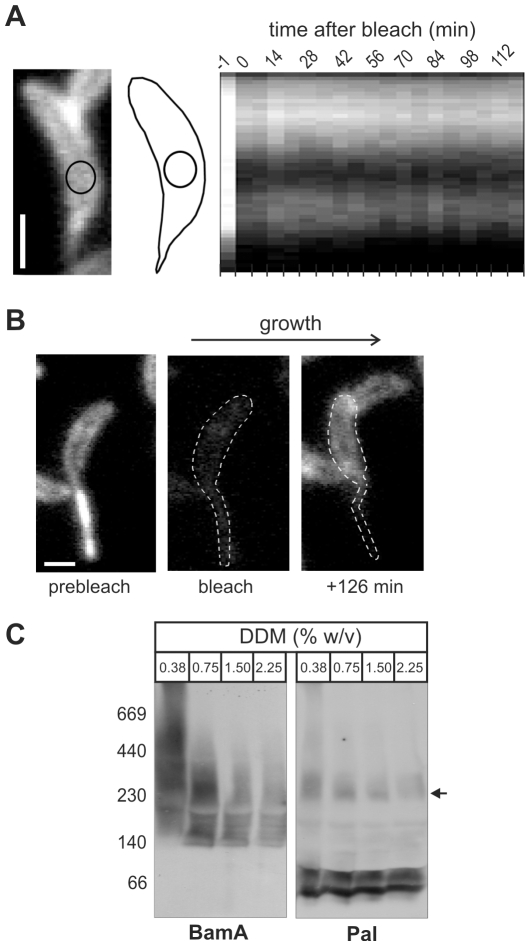
Figure 5. Pal anchors the BAM complex to the peptidoglycan layer of the cell wall.
(A) Photobleaching analysis of Pal-mCherry dynamics required pre-treatment with chloramphenicol to block protein synthesis, and cells expressing Pal-mCherry were immobilized on an agarose-padded slide containing chloramphenicol. The left panel shows a representative cell in which the circle indicates the region that will be photobleached. The right panel shows a kymograph representation of Pal-mCherry fluorescence intensity along the cell axis before (−1 min) and following photobleaching. (B) Fluorescence micrographs showing a cell expressing Pal-mCherry before photobleaching (left), right after being completely photobleached (middle) and after 126 min of growth (right). (C) Outer membrane vesicles (100 µg protein per lane) from cells expressing Pal-mCherry were solubilised with dodecyl-maltoside and analysed by blue native-PAGE and immuno-staining with antisera recognizing either Pal or BamA. The migration position of molecular markers (kDa) are shown, arrow indicates the 300 kDa form of the BAM complex. Scale bars (white) represent 1 micrometer.

