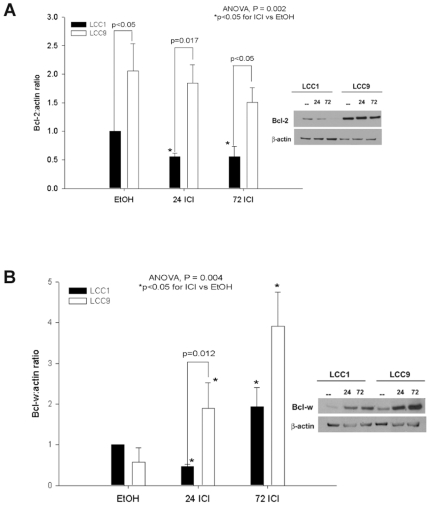
Figure 1. Increased expression of BCL-W and BCL2 in MCF-7/LCC9 cells.
Whole cell lysates were subjected to Western blot analysis with a specific BCL2 or BCL-W antibody. (A) Bars represent the mean±SE of the relative BCL2∶actin ratio (normalized to control cells) for three independent experiments. Inset, a representative blot. (B) Bars represent the mean±SE of the relative BCL-W∶actin ratio (normalized to control cells) for three independent experiments. Inset, a representative blot.

