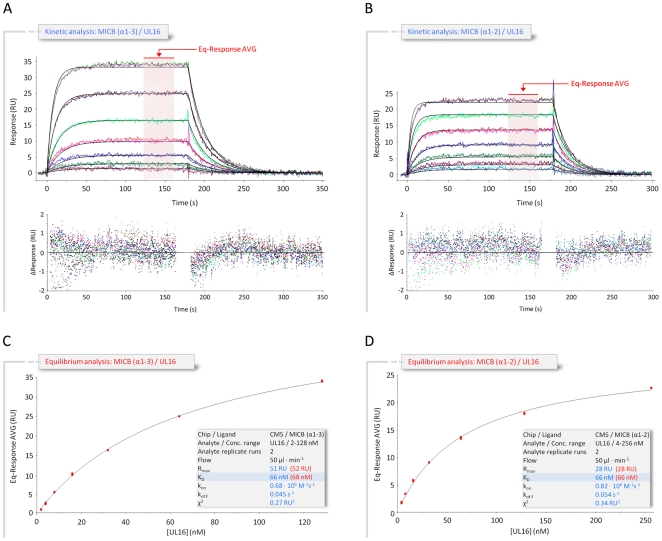
Figure 2. Kinetic and equilibrium SPR analyses of UL16 interactions with MICB.
(A,B) Kinetic analyses of UL16 binding to covalently immobilized MICB proteins comprising domains α1 and α2 only (MICBpf) (A), and domains α1, α2 and α3 (B). Each individual analyte concentration was injected twice and data are representative of at least two separate experiments with similar results. Double-referenced sensorgrams (shown in color) are overlaid with fits of a “1∶1 binding with mass transfer” model (black lines). Corresponding residual plots below the sensorgrams show the kinetic-fit range and absolute deviation (Δ) of data points from curve fit values. The red arrow and the red highlighted area of the sensorgram series indicate data used to determine averaged (AVG) equilibrium (Eq) response values (Eq-Response AVG) for equilibrium analysis. (C,D) Equilibrium analysis of UL16 binding to MICBpf (C) and MICB domains α1, α2 and α3 (D). Averaged equilibrium response values (red squares) are plotted against injected UL16 concentrations and fitted to a “1∶1 Langmuir isotherm” model (black line). The shaded boxes contain additional information about setup details (black font) and measured parameters from kinetic (blue font) and equilibrium analysis (red font).

