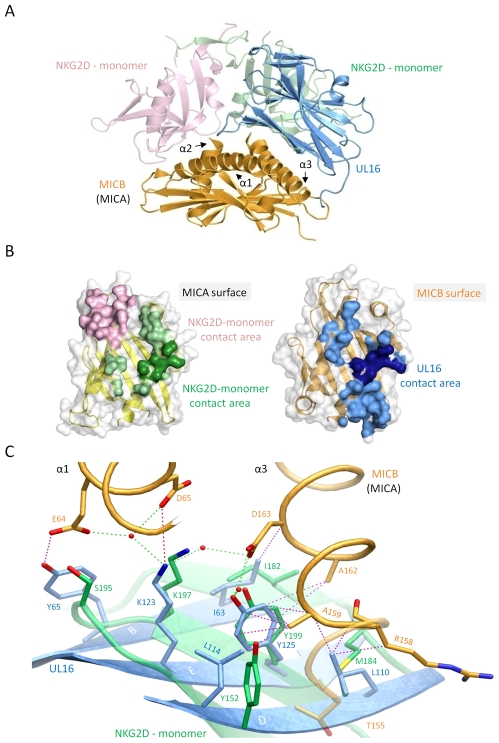
Figure 5. Comparison of the UL16-MICBpf and NKG2D-MICA complex structures.
In all panels, the two NKG2D monomers are shown in salmon and green, whereas UL16 and MICBpf are colored blue and orange, respectively. (A), Superposition of the UL16-MICBpf complex onto the MICA-NKG2D complex [26]. MICA, which is very similar to MICB, is not shown for clarity. (B), Ribbon drawings of the α1α2-platform domains of MICA (left side, yellow) and MICB (right side, orange), with their molecular surfaces outlined in grey. Surface-exposed areas of residues that are buried upon complex formation with NKG2D and UL16, respectively, are colored using the color scheme of panel (A). MICB/MICA residues 155, 158, 159, 162 and 163, which contact both UL16 and NKG2D in a similar manner are shown in darker green and blue shading, respectively. (C), Structural mimicry of UL16. Close-up view of the core region of the structures shown in panel (A) with UL16 residues Ile63, Lys123, Tyr125, Leu110, Leu114 that superimpose with chemically equivalent NKG2D residues Ile182, Lys197, Tyr199, Met184 and Tyr152. Side chain atoms, UL16-MICBpf contacts, and water molecules are colored as described in the legend to Figure 4.

