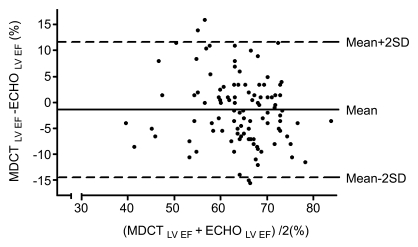
Figure 2b:
(a) Quantitative LV EF by using multidetector CT with threshold level–based method had good correlation as compared with echocardiography in 102 patients (y = 1.02x, r = 0.68, P < .001). (b) Bland-Altman analysis shows trend toward slight underestimation of LV EF by using multidetector CT in comparison with echocardiography (mean difference, −2% ± 12). SD = standard deviation.

