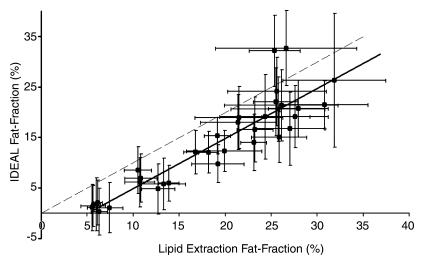
Figure 3c:
Graphs show lipid extraction mass fat fractions plotted against imaging fat fraction measurements. (a, b) Single peak (a) without and (b) with T2* correction. (c, d) Multipeak (c) without and (d) with T2* correction. Statistical parameters are summarized in Table 3. Dashed lines=line of unity, error bars=measured standard deviation. All reconstructions showed an intercept that was significantly different from 0.0; however, only reconstructions that included multiple peaks of fat showed slopes that were not significantly different from 1.0.

