
Table 2.
Comparison of 15-Echo Fat Fraction Measurements with Quantitative Histologic Grading
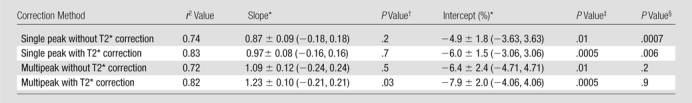
*
Data are means ± standard deviations. Data in parentheses are 95% confidence intervals.
†
P > .05 indicates no significant difference between obtained slope and 1.0.
‡
P > .05 indicates no significant difference between obtained intercept and 0.0.
§
P > .05 indicates no significant difference between imaging fat fraction and quantitative histologic fat fractions.