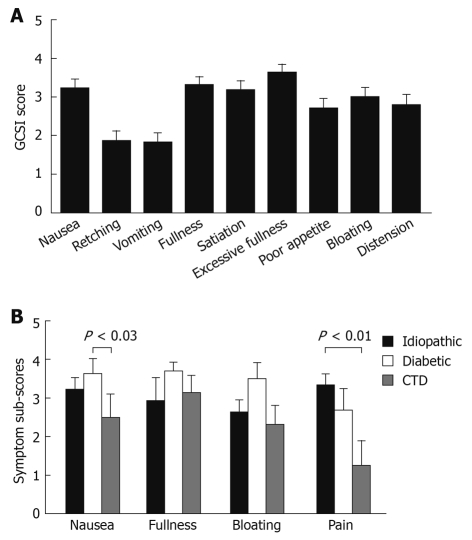
Figure 1.
Symptom severity scores in patients with gastroparesis. The individual GCSI scores are shown for the entire group (A). Component sub-scores for the GCSI and pain ratings are summarized for the three major patient groups, to allow comparison between the different etiologies of gastroparesis (B). Significant differences were seen for nausea (diabetes vs connective tissue disease) and pain (idiopathic vs connective tissue disease). CTD: Connective tissue disease; GCSI: Gastroparesis Cardinal Symptom Index.

