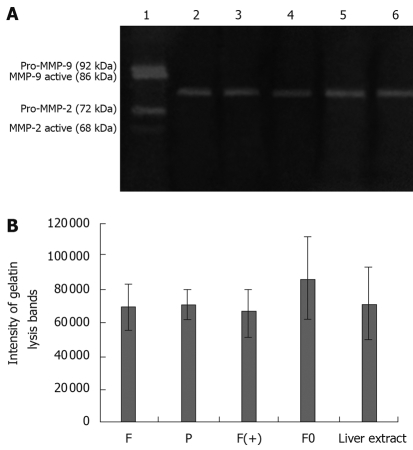
Figure 4.
Zymographic analysis of MMPs activity of tumor cells in liver extract (A); the intensity of gelatin lysis bands obtained by scanning densitometry (LabWorks UVP GDS-800 Version 4.0) (B). 1. Type IV collagenases; 2. F; 3. P; 4. F(+); 5. F0; 6. Liver extract. F: Hca-F cells; P: Hca-P cells; F(+): Hca-F cells transfected with pIRESpuro3 osteoglycin(+); F0: Hca-F cells transfected with pIRESpuro3.

