
Figure 2.
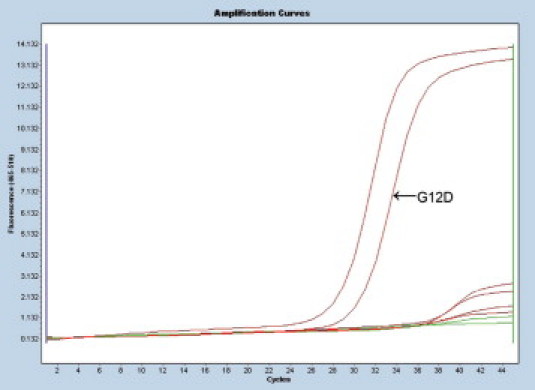
Raw amplification curves for KRAS mutant tumor sample tested by the ARMS/S method. Each curve represents an amplification product of the same DNA template for one of eight specific primer sets. The curve on the farthest left is for wild-type control primers. The next curve to right represents amplification products for mutant template (GGT→GAT, G12D). The remaining curve is for the wild-type template. A positive result is determined by the cross point, the point on each curve where the slope of the curve becomes linear. There is a clear separation between mutant product (CP 29.6) and non-mutant product (CPs >38.5). The difference between CP for the wild-type control DNA and the mutant DNA (ΔCP) is small (2.4 cycles), indicating a mutation.