
Figure 4.
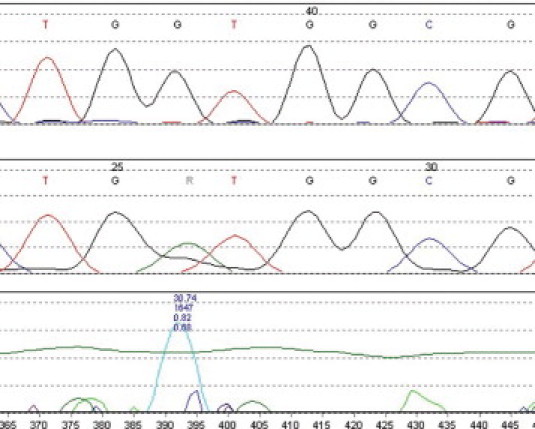
Mutation Surveyor readout for KRAS codon 12 mutation (GGT→GAT, G12D), forward primer set. Top tracing is for wild-type control. Mutant tracing is shown in the center. The chomatogram peak differences are calculated by the Mutation Surveyor program and plotted in the bottom tracing. Numbers refer to areas under the curve. The horizontal green line indicates the calculated threshold level for the mutation call. Visual inspection of chromatograms are required to indentify mutation peaks that fall below the threshold of detection of the software, as well as for false positives due to band compression or other sequencing artifacts.