
Figure 5.
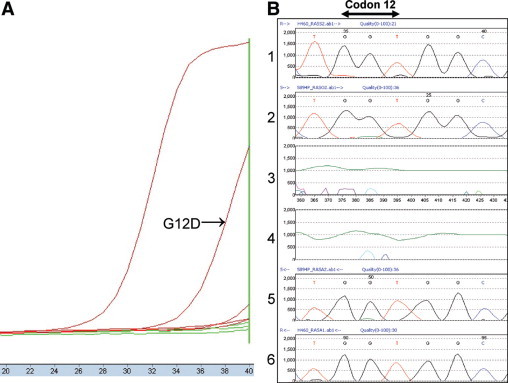
Example of discrepancy between ARMS/S and direct sequencing. On the left (A), ARMS/S amplification curve for mutant tumor DNA (G12D) is clearly separated from that of non-mutant control DNA with ΔCP of 7.3, a value that is within the range indicating mutation. On the right (B) is a chromogram for direct sequencing results for KRAS codons 12 and 13. In frames 1 and 6, tracings of forward and reverse control DNA strands are shown. Tracings for forward and reverse test DNA strands are shown in frames 2 and 5. Frames 3 and 4 show difference plots for forward and reverse strands calculated by Mutation Surveyor software. There is a low peak (A) corresponding to the expected mutation, but the height of the peak is below the level background and cannot be confidently interpreted as a mutation.