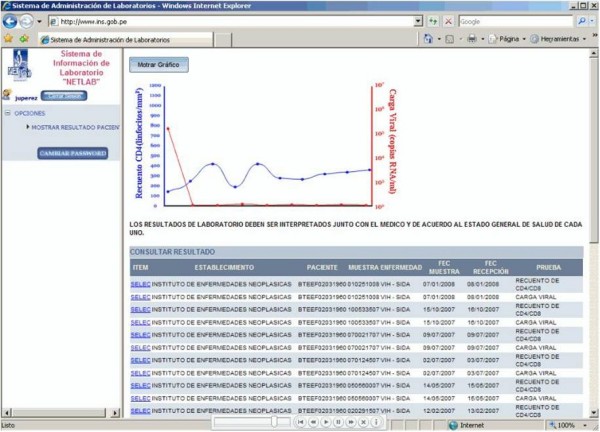
Figure 4.

Presentation of individual CD4 count and viral load results over time. Shows historical test results for a HAART patient, including 10 CD4 counts and 10 viral loads, which are available to the patient and the patient's health provider through the NETLAB system.
