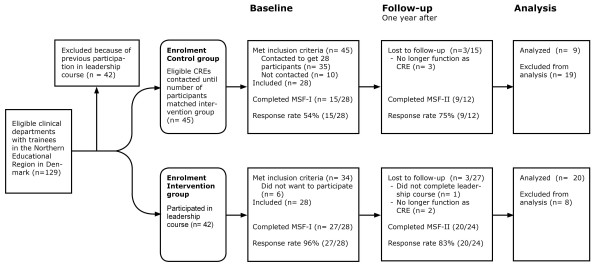
Figure 1.
Flowchart of the study. Figure 1 shows the flowchart of the study. The number of consultants responsible for postgraduate medical education in clinical departments (CRE) included in the intervention and the control group. Intervention was a seven-day leadership course combined with a multisource feedback procedure before (MSF-I) and one year after (MSF-II) participation in the course. The control group went through both MSF-I and MSF-II. Response rate for CREs in both MSF-I and MSF-II is provided.

