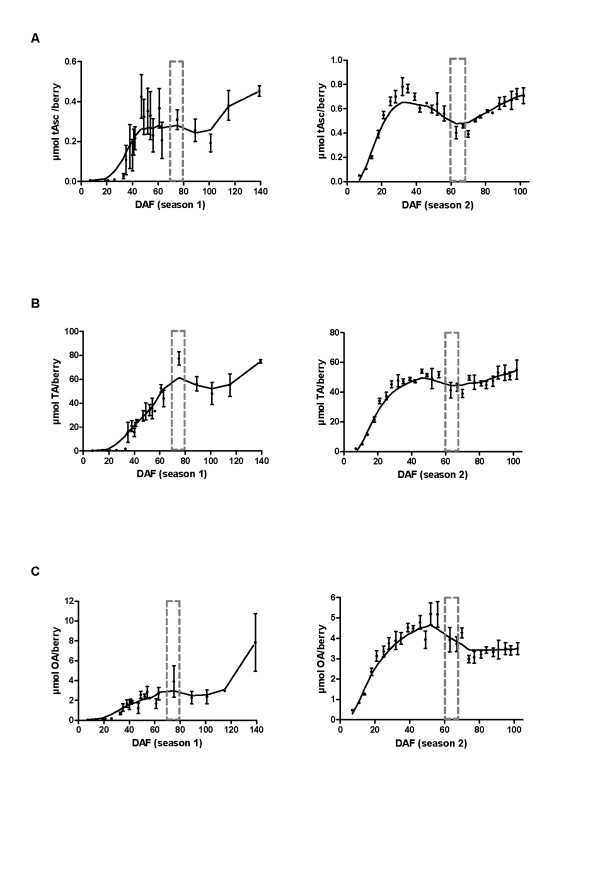
Figure 2.
Accumulation of total ascorbate (tAsc) and the ascorbate catabolites tartaric (TA) and oxalic acids (OA). All graphs in the left-hand panel show Vitis vinifera c.v. Shiraz berries grown in 2005-2006 (season 1) where n = 3 and displaying SEM bars. All graphs in the right-hand panel show V. vinifera c.v. Shiraz berries grown in 2007-2008 (season 2) where n = 4 and displaying SEM bars. A. Accumulation of tAsc, B. Accumulation of TA, C. Accumulation of OA. The developmental stage of veraison is indicated by a grey dotted box.

