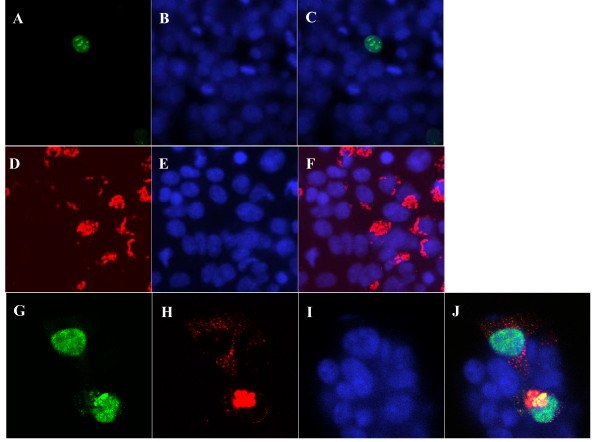
Figure 3.
Confocal micrographs of NS1 and Gas8 in 293FT cells. Panels (A) and (G): GFP. Panels (D) and (H): DsRed. Panels (B), (E), (I): DAPI. Panels (C), (F), (J): merged images. Top row: cells transfected with pEGFP-NS1 showing nuclear localization. Middle row: cells transfected with pDsRed-GAS8 showing juxtanuclear localization. Bottom row: co-expression of NS1 and Gas8 showing juxtanuclear localization.

