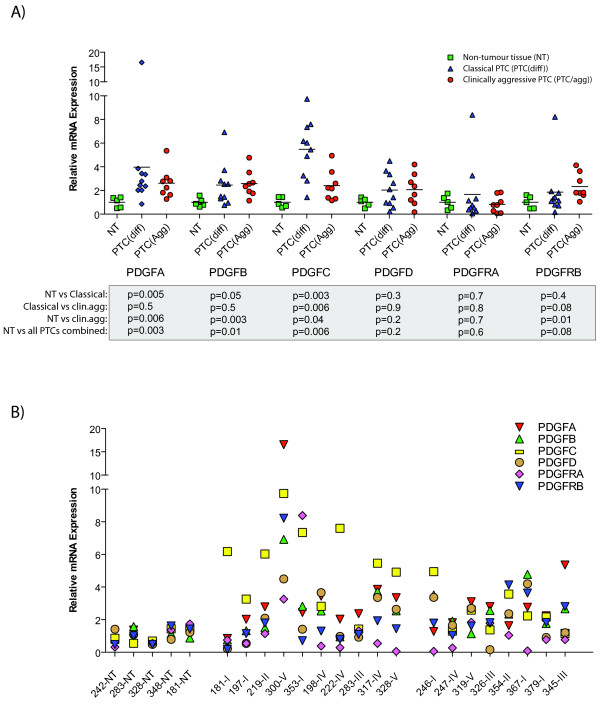
Figure 1.
mRNA expression of PDGF ligands and receptors. mRNA expression of PDGF ligands and receptors calculated relative to mRNA expression levels of the endogenous control (ACTB) in A) non-euplastic thyroid tissue (NT, green) and a collection of classical (PTC(diff), blue) and clinically aggressive PTCs (PTC(agg), red). All values were adjusted so that the median value of the NT group was equal to one. Bars indicate median value of each individual group. P-values (below) are from Mann-Whitney t-test between groups, as indicated. B) Relative mRNA expression of all PDGF ligands and receptors in each individual biopsy. PDGFA (red triangle), PDGFB (green triangle), PDGFC (yellow square), PDGFD (brown circle), PDGFRA (magenta diamond) and PDGFRB (blue triangle). All values were adjusted so that the median value of the NT group was equal to one.

