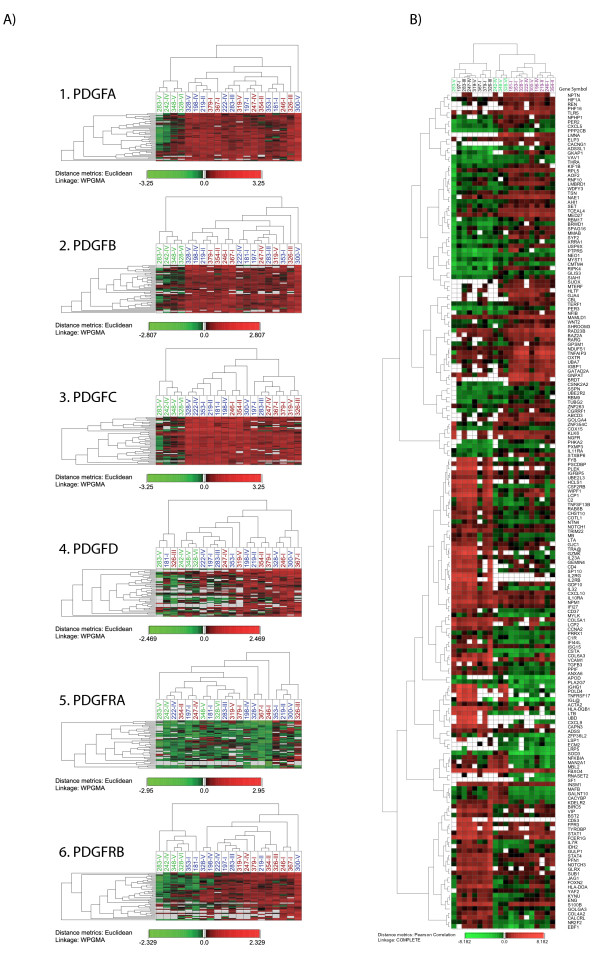
Figure 4.
Hierarchical cluster analysis. A) Cluster analysis of genes selected by performing an expression profile similarity search for each of the PDGF family members. In each selection 0.5% of 9262 expression profiles with the highest similarity with each PDGF were selected (46 expression profiles). Normal thyroid tissue (green), classical PTCs (blue) and clinically aggressive PTCs (red). B) Cluster analysis based on 189 individual gene expression profiles selected by performing SAM analysis on the complete dataset of 9262 gene profiles between tumours grouped according to hierarchal clustering of 46 gene profiles with the highest similarity to PDGFC (biopsies 181-I, 198-IV, 219-II, 353-I, 222-IV, 328-V, 246-I, 354-II and 300-V in group 1(magenta) and biopsies 197-I, 283-III, 247-IV, 367-I, 379-I, 319-V and 326-III in group 2 (black). Normal thyroid tissue is labelled green. The colour scale below each figure illustrates the relative expression level as compared to the reference.

