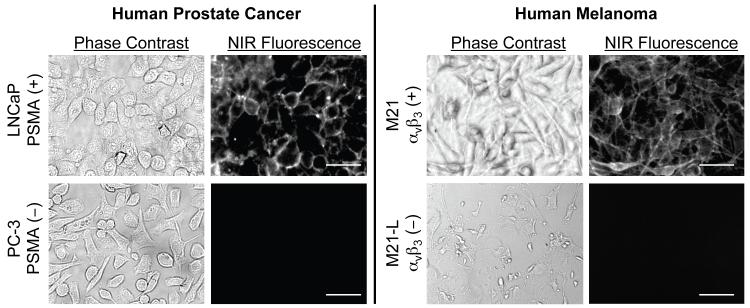
Figure 2.
Live cell binding of targeted QDs in vitro: NIR fluorescence imaging of QD-CW-GPI after incubation with PSMA-positive LNCaP and PSMA-negative PC-3 prostate cancer cells (left), and of QD-CW-cRGD after incubation with αvβ3-positive M21 and αvβ3-negative M21-L melanoma cells (right). For each are shown phase contrast (left) and NIR fluorescence (right) images. Fluorescence images have identical exposure times and normalizations. Scale bar = 10 μm.

