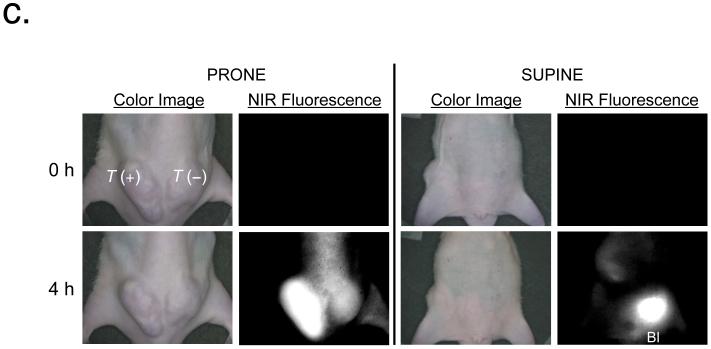
Figure 4.
In vivo fluorescence imaging of human prostate cancer and melanoma xenograft tumors. a, 10 pmol/g (0.2 μg/g) of QD-CW-GPI was injected intravenously and observed for 4 h. The PSMA-positive LNCaP tumor (T+) and PSMA-negative PC-3 tumor (T-) are indicated. Shown are representative (n = 5 animals) images of color video (left) and NIR fluorescence (right) for animals in prone (left) or supine (right) position. b, In situ (top row) and resected (bottom row) organs from (a) were imaged 4 h post-injection with color video (left) and NIR fluorescence (right). c, 10 pmol/g (0.2 μg/g) of QD-CW-cRGD was injected intravenously and observed for 4 h. The αvβ3-positive M21 tumor (T+) and αvβ3-negative M21-L tumor (T-) are indicated. Shown are representative (n = 5 animals) images of color video (left) and NIR fluorescence (right) for animals in prone (left) or supine (right) position. d, In situ (top row) and resected (bottom row) organs from (c) were imaged 4 h post-injection with color video (left) and NIR fluorescence (right). Ki, kidneys; Du, duodenum; Sp, spleen; In, intestine; Lu, lungs; Li, liver; Pa, pancreas; Ab, abdominal wall; and Bl, bladder.


