
Figure 5.
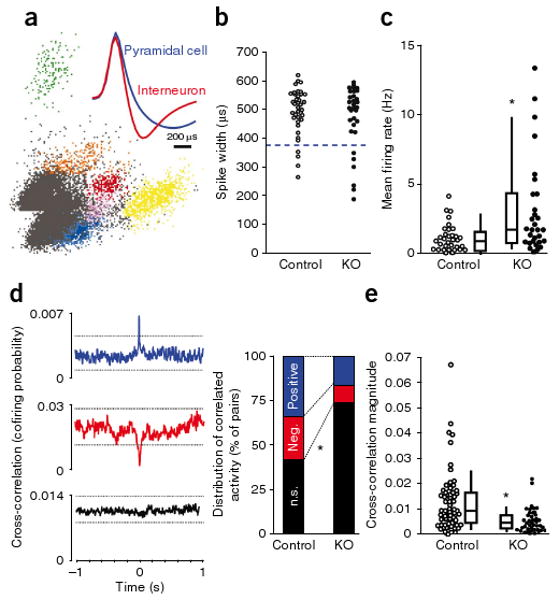
Increased firing of cortical excitatory neurons accompanied by reduced neuronal synchrony. (a) A representative cluster analysis of spike waveforms, sorted into individual units on the basis of spike amplitude distribution. Inset, average spike shape for putative pyramidal neuron (blue) and interneuron (red). Note the characteristic difference in the slope of the afterhyperpolarization phase. (b) No difference in spike-width distributions in neurons recorded from S1 in 13–14 week-old freely moving mutant mice (Ppp1r2-cre+/−; NR1loxP/loxP-line A, n = 4, KO) and controls (n = 2 for Cre (Ppp1r2-cre+/−), n = 2 for Flox-A (NR1loxP/loxP-line A)) during exploration of an unfamiliar linear track. Units with spike widths >380 μs were considered to be putative pyramidal neurons. (c) Mean firing rates of putative S1 pyramidal neurons were significantly higher in mutant mice compared with controls. Each dot is the mean firing rate for an individual neuron (n = 34 control, n = 29 mutant mice). Box plots depict medians (box centers), interquartile ranges (box boundaries) and 10–90th percentiles (whiskers). Mann-Whitney U test, * P < 0.005. (d) Synchronized activity of pairs of nearby neurons from the recording shown in c was assessed by computing the cross-correlation for all pairs of pyramidal neurons recorded from a single tetrode. Representative cross-correlograms from controls exemplifying three different correlation responses: significantly positive (blue), significantly negative (red) and nonsignificant cross-correlation (black). Dotted lines indicate 99% confidence interval. Mutants showed a higher incidence of nonsignificantly correlated pairs of neurons (controls, 26 of 62 pairs (42%); mutant mice s, 31 of 42 pairs (74%); χ2 test, * P < 0.005]. (e) Decrease in the magnitude of cross-correlations across all pairs in mutant mice regardless of the polarity. Each dot represents an individual pair. Mann-Whitney U test, * P < 0.0005.