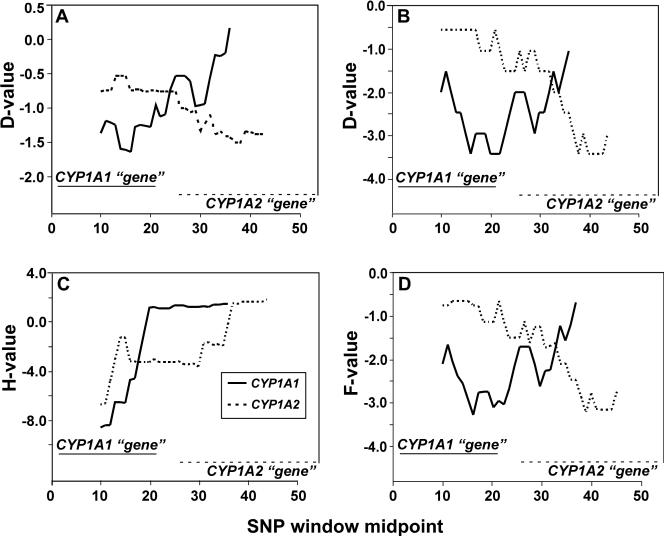
FIGURE 6.
Neutrality test (by sliding windows) for the CYP1A1 and CYP1A2 haploblocks. Each panel shows results of a different neutrality test: (A) Tajima's D test; (B) Fu & Li's D test; (C) Fay & Wu's H test; (D) Fu & Li's F test. The size of the sliding window was 20 SNPs, with the window moving by increments of one SNP. For purposes of comparison, in the graph for each test we have combined the results of two independent tests: one for the CYP1A1 haploblock (46 SNPs; SNPs #1–46 from Supp. Table S1, solid line), the other for the CYP1A2 haploblock (54 SNPs; SNPs #49–102 from Supp. Table S1, dashed). Abscissa denotes the nucleotide position corresponding to the midpoint SNP of each window, and the positions of the two “genes” are also depicted.

