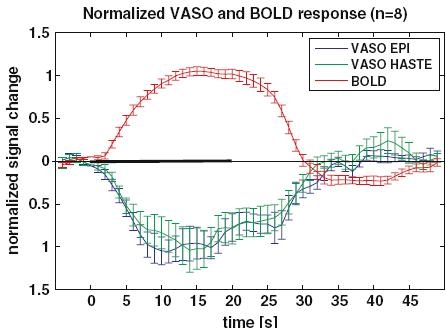
Fig. 2.

Averaged stimulus response (n = 8) of the EPI and HASTE VASO activation (P < 0.0004). Note the decline of the CBV well before the end of the stimulus; this behaviour is much less pronounced in the BOLD response. The VASO curves show a nearly identical signal timecourse, with a return to baseline that essentially coincides with that of the BOLD (error bars = SEM). The stimulation period is indicated by the solid line on the time axis. The baseline was taken as the average of the 5 s before stimulus onset
