
Figure 1.
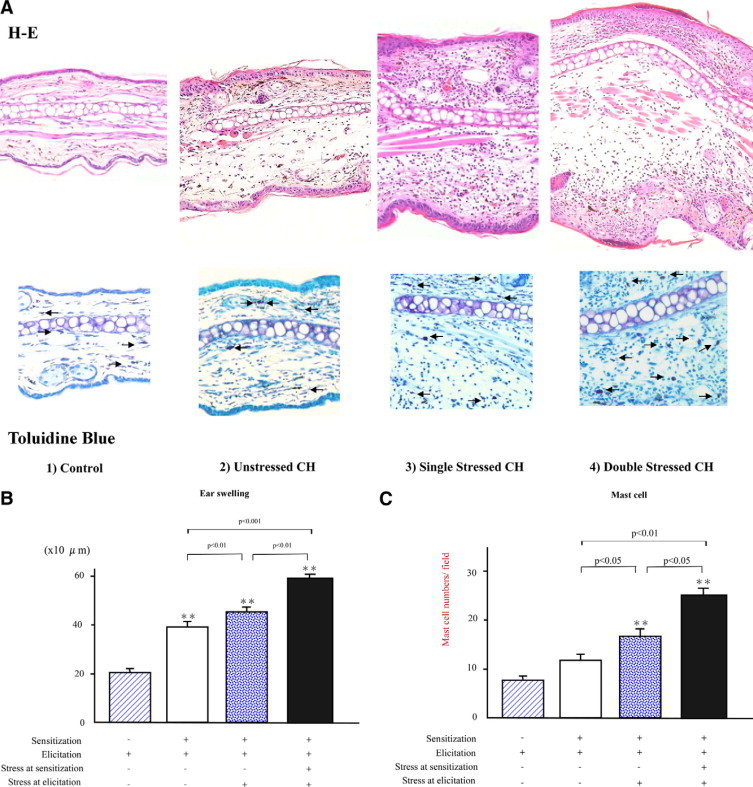
A: Top: Representative histological sections of the ear pinnae from mice without sensitization and CH mice with or without stress 48 hours after oxazolone elicitation. The sections were stained with H&E. The mice were grouped as follows: (1) control; (2) unstressed; (3) single stressed; and (4) double stressed. Original magnification, ×100. More prominent edema and leukocyte infiltration were noticed in the pinnae from the stressed CH mice relative to the unstressed and control mice. Bottom: Representative histological sections showing mast cell accumulation in the ear pinnae, where mast cells were detected as cells with metachromatic staining of granules in toluidine-blue stain (arrows). Original magnification, ×120. B: Total ear thickness 48 hours after oxazolone elicitation in mice without sensitization and in CH mice with or without stress. The ear thickness was measured 48 hours after oxazolone elicitation. All values represent the mean ± SEM of results obtained from 8 to 10 mice in each group. Single-stressed and double-stressed CH mice exhibited significant increases relative to the unstressed CH mice (P < 0.01, P < 0.001, respectively). Furthermore, double-stressed mice exhibited a more significant increase than the single-stressed mice (P < 0.01). **P < 0.001 vs Ag-elicited mice without sensitization. C: Mast cell numbers in the dermis of pinnae from mice without sensitization, the control, unstressed, and stressed CH mice 48 hours after oxazolone elicitation. Mast cell numbers per dermis section in high-power microscopic field (0.07 mm2) were determined by counting in paraffin sections stained with toluidine blue. Both types of stressed CH mice showed significant increases as compared with the unstressed ones (P < 0.05, P < 0.01, respectively). Furthermore, the double-stressed mice exhibited a more significant increase than the single-stressed mice (P < 0.05). All values represent the mean ± SEM of results obtained from 8 to 10 mice in each group. **P < 0.01 vs Ag-elicited mice without sensitization.