
Figure 8.
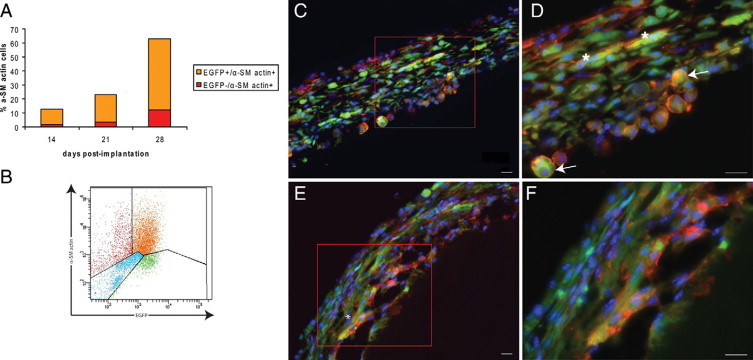
Macrophage-to-myofibroblast transdifferentiation within the tissue capsule. A: Histogram shows the proportions of total cells expressing α-SM actin (alone or co-expressing EGFP) within the tissue capsule at days 14, 21, and 28. B: Representative FACS profile of α-SM actin expression by day 28 tissue capsule cells. C: Photomicrographs show expression of EGFP (green) and α-SM actin (red) in day 14 tissue capsules. D: Higher magnification shows cells of rounded morphology (arrows) and elongated cells (asterisk) co-expressing EGFP and α-SM actin. E: Many elongated cells co-expressing EGFP and α-SM were observed at day 28. F: Higher magnification. Nuclei counterstained with Hoechst 33342 (blue). Scale bars = 20 μm. Representative images are from n = 6 mice for each time point, from two independent experiments.