
Figure 4.
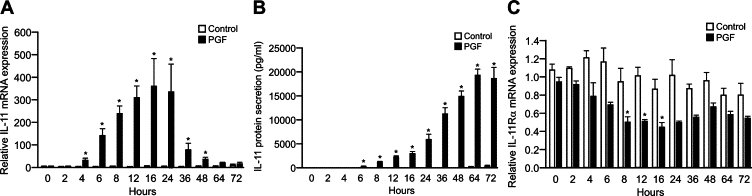
IL-11 and IL-11Rα expression in Ishikawa FPS cells in response to 100 nmol/L PGF2α. IL-11 mRNA (A) and protein (B) expression in Ishikawa FPS cells following treatment of cells for 0, 2, 4, 6, 8, 12, 16, 24, 36, 48, 64, and 72 hours with vehicle or 100 nmol/L PGF2α as measured by real-time quantitative RT-PCR analysis and ELISA, respectively. Data are represented as mean ± SEM *P < 0.001 for PGF treatment compared with control treatment. C: IL-11Rα mRNA expression in Ishikawa FPS cells following treatment of cells for 0, 2, 4, 6, 8, 12, 16, 24, 36, 48, 64, and 72 hours with vehicle or 100 nmol/L PGF2α as measured by real-time quantitative RT-PCR analysis. Data are represented as mean ± SEM *P = 0.04, for 8 hours, and **P = 0.03 for 12, and 16 hours, for PGF treatment compared with control treatment.