
Figure 1.
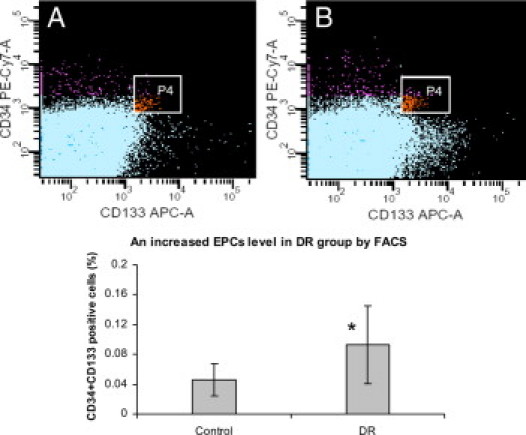
Increased circulating EPC levels in DR group versus controls shown by flow cytometry analysis. Representative flow cytometry patterns from (A) a normal control and (B) a DR patient. EPCs were defined with positive expression for both CD133-allophycocyanin (forward scatter) and CD34-Pe-cy7 (side scatter). P4 (window) represents CD34 AC133 double positive populations. The graph below the photographs displays the statistical analysis comparison, which indicates an increased percentage of EPCs in DR group (DR: 0.093 ± 0.052%, vs. control: 0.045 ± 0.02%, n = 20, *P < 0.01).