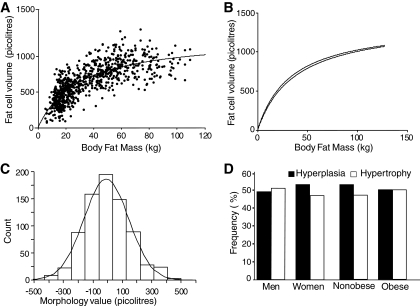
FIG. 1.
Adipose morphology. A: Curve-linear relationship between fat cell volume and fat mass in all 764 subjects. B: Comparison of curves obtained from fat mass measured with a formula and by bioimpedance in a subset of 555 subjects. C: Distribution of adipose tissue morphology values. D: Frequency of different forms of morphology in male (n = 207), female (n = 557), nonobese (n = 300), and obese (n = 404) subjects. The morphology value is defined in the results section.

