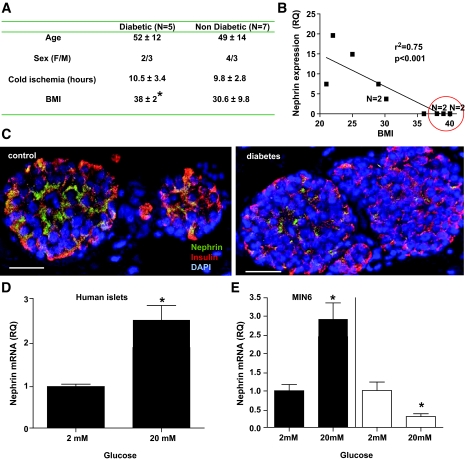
FIG. 1.
Modulation of nephrin expression by diabetes and glucose. A: Characteristics of pancreas donors with or without type 2 diabetes. BMI was significantly different among groups. B: Correlation between the nephrin mRNA expression relative quantification (RQ) in isolated islets and BMI among the 12 patients studied. An r2 of 0.75 with P < 0.001 revealed that higher BMIs were associated with lower nephrin expression. Circled in red are the five diabetic donors. n = 2 denotes overlapping points. C: A representative immunofluorescence confocal image for nephrin, insulin, and DAPI in human islets from a diabetic and nondiabetic donor is shown (20× magnification). A white scale bar of 50 μm is provided. D–E: Quantitative analysis of nephrin mRNA expression in human islets (D) or MIN6 cells (E, ■) cultured at either 2 or 20 mmol/l glucose for 24 h. Chronic exposure to high glucose concentration was tested in MIN6 cells only. Cells “starved” in 2 mmol/l glucose for 7 days were assigned to either 2 or 20 mmol/l glucose culture for an additional 14 days. A downregulation of nephrin mRNA expression was observed (E, □). Mean and SD of four independent experiments are shown. *P < 0.05. (A high-quality color digital representation of this figure is available in the online issue.)

