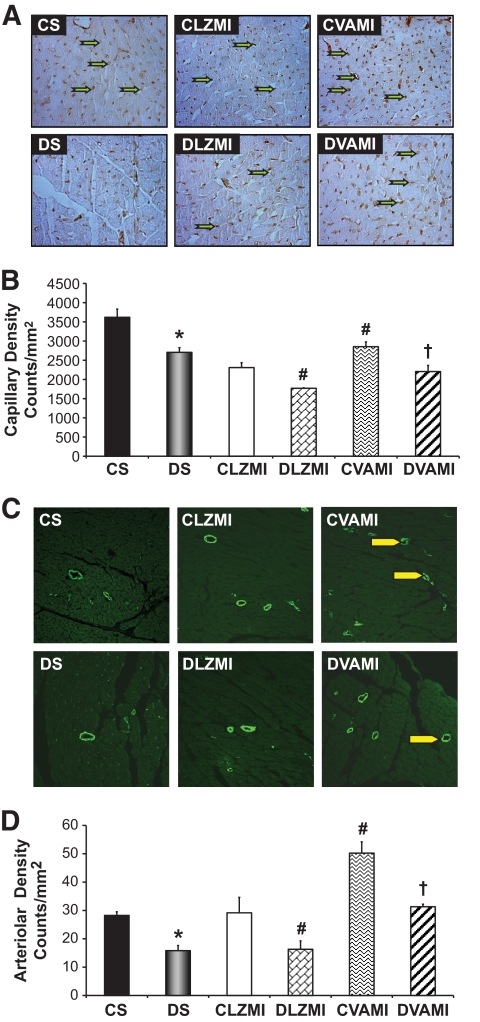
FIG. 3.
Effect of combination gene therapy on capillary and arteriolar density 7 days after the intervention. Representative images (A) and graphical representation (B) of capillary density analysis among the different groups (counts/mm2). Representative images (C) and graphical representation (D) of arteriolar density analysis among the different groups (counts/mm2). There was a significant increase in the capillary and arteriolar density in the CVAMI and DVAMI groups compared with the CLZMI and DLZMI groups, respectively. CS (black solid bar), nondiabetic control sham; DS (gray solid bar), diabetic sham; CLZMI (white bar), nondiabetic control animals that received Ad.LacZ injections; DLZMI (diagonal brick bar), diabetic animals that received Ad.LacZ injections; CVAMI (wave bar), nondiabetic control animals that received combination gene therapy; and DVAMI (wide upward diagonal bar), diabetic animals that received combination gene therapy. Values are presented as mean ± SEM. *P ≤ 0.05 when DS is compared with CS, #P ≤ 0.05 compared with CLZMI, †P ≤ 0.05 when DVAMI is compared with DLZMI. (A high-quality color digital representation of this figure is available in the online issue.)

