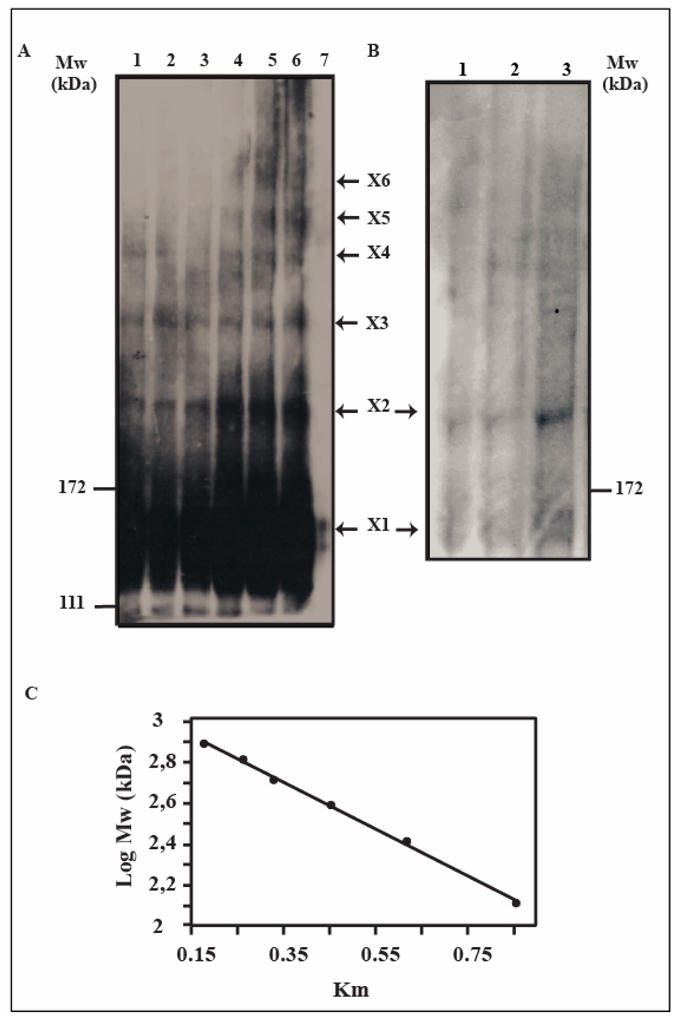
Fig 5. Oligomeric state of VE-cadherin at the surface of cells expressing VE-cadherin.

Panel A:Western blot analysis of EaHy cell surface-cross-linked VE-cadherin
EaHy cells were incubated with increasing concentrations of DTSSP (lanes 1: 0.05; 2: 0.2; 3: 0.4; 4: 0.8; 5: 1.6; 6: 3.2 mM of DTSSP). A control was obtained by incubating the cell monolayer with a dissociating Anti-VE-cadherin antibody before cross-linking with 3.2 mM of DTSSP (lane 7). Following cell lysis under non reducing conditions, lysates were electrophoresed on a 5% SDS polyacrylamide gel and subjected to Western blot analysis using a polyclonal antibody directed against EC3 VE-cadherin domain. The arrows at the right margin indicate the presence of VE-cadherin cross-linked products. The molecular weight of prestained marker proteins are indicated at the left.
Panel B: Western blot analysis of VE-cadherin cross-linked at the surface of VE-CadM3-GFP-transfected CHO cells.
VE-CadM3-GFP-transfected CHO cells were incubated with increasing concentrations of DTSSP (lanes 1: 0.8; 2: 1.6; 3: 3.2 mM of DTSSP). The lysates and the Western blot analysis were performed as previously described for EaHy cells (Panel A).
Panel C: Correlation between the migration coefficient and the molecular weight attributed to the immunoblotted bands.
Considering a 135 kDa molecular weight for VE-cadherin, the molecular weight of each electroblotted band was calculated from the hypothetical oligomeric state (X1: monomer, X2: dimer, X3: trimer, X4: tetramer, X5: pentamer, X6: hexamer). A linear correlation was then established between the migration coefficients Km and the molecular weight of the immunoblotted bands.
