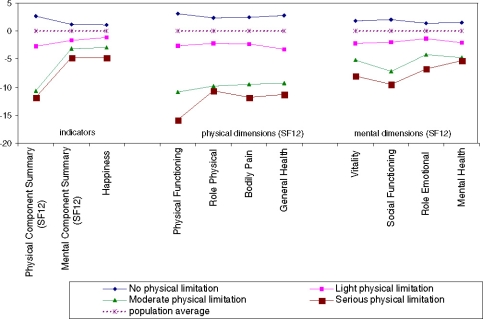
Fig. 2.
Perceived physical and mental health and happiness in the Dutch non-institutionalized population of 12 years and older with regard to the level of physical limitation, 2001 (scale values). Source: Statistics Netherlands (POLS’01), SCP processing Note: The scales are standardised to the Dutch population with a mean of zero and a standard deviation of 10 points. The indicators (on the left) are based on the corrected Physical Component Summary and the regular Mental Component Summary scores of the Short Form 12 [6]

