Fig. 3.

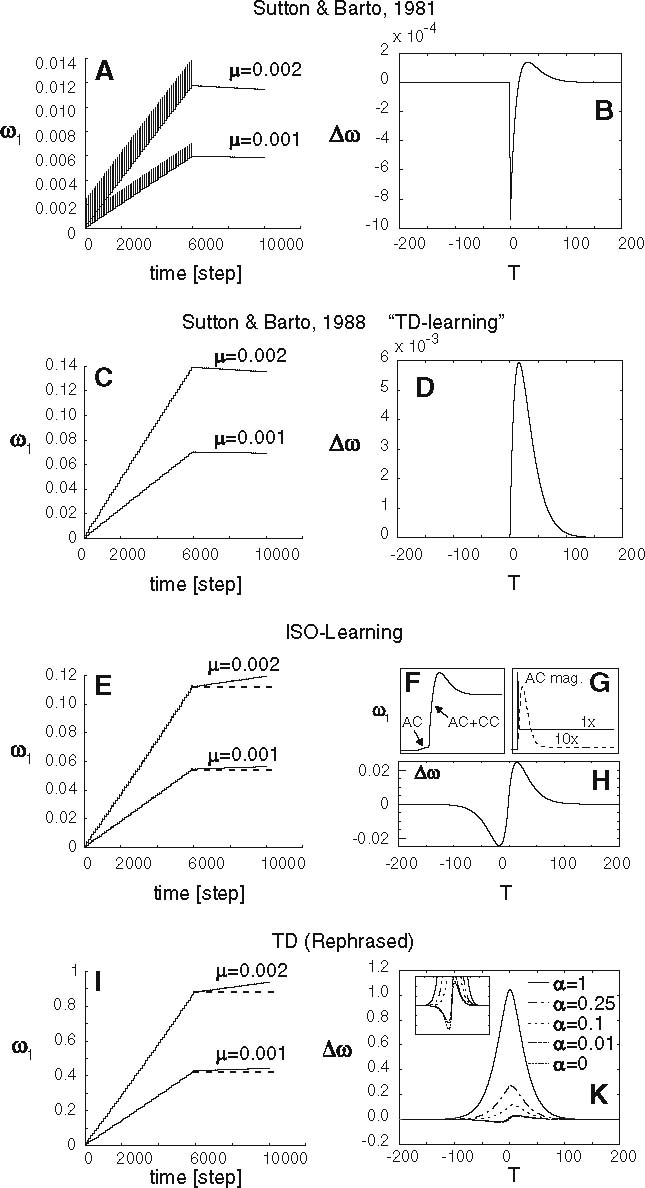
Quantitative results from the architectures shown in Fig. 2. The left panels show weight growth of ω
1 during learning with two different learning rates μ = 0.001 and μ = 0.002. The parameters of the band-pass were a = 0.3, b = 0.33 and σ = 0.03. The right panels show the relative weight change when learning starts (ω
1 = 0) for different temporal intervals T between x
0 and x
1. A positive value of T stands for  and vice versa. a, b Model of Sutton and Barto (1981), c, d TD-learning (Sutton 1988). e-h ISO-learning (Porr and Wörgötter 2003). f, g show the temporal development of the weight change for a single input pulse pair. f Comparison of the AC and the combined AC + CC term. g Comparison of the AC term on a magnified scale for two different sampling rates (1x, 10x) to show the numerical accuracy. i, k TD-Rephrased, where k is plotted for different values of α and the inset shows an enlargement around the origin
