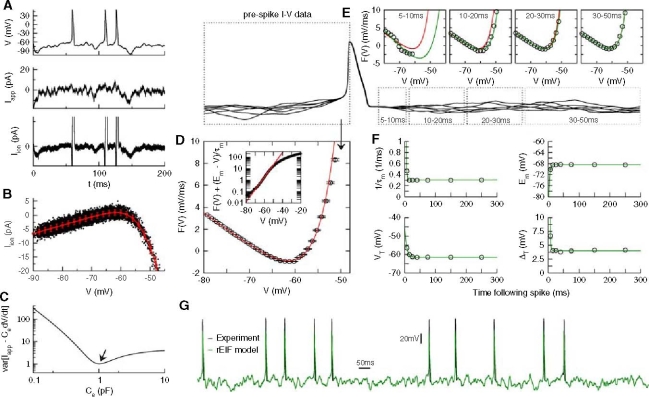
Fig. 1.
Summary of the dynamic I–V curve method and its application to the Wang-Buszáki model. a The derivative of the membrane voltage (top graph), multiplied by the cellular capacitance, is subtracted from the injected current (middle graph) to yield the intrinsic membrane current I
ion (bottom graph). b The intrinsic membrane current I
ion is plotted against the membrane voltage (black symbols). The dynamic I–V curve (red symbols) is obtained by averaging I
ion in small voltage bins. Error bars represent the standard deviation. c Measuring the cellular capacitance. At a fixed subthreshold voltage, the dynamic membrane current  has a variance that depends on the value of C used in the calculation; the correct value of C corresponds to the point of minimal variance. d Relating dynamic I–V curves and non-linear integrate-and-fire models. The function
  (symbols) is plotted as a function of voltage, together with the EIF model fit (red line). Inset: semi-log plot of F(V) with leak current subtracted, showing a nearly exponential run-up. e Spike-triggered dynamic I–V curves. The functions F(V) measured in small time slices after each spike (symbols) are plotted together with the the EIF fit (green) and the pre-spike I–V curve as a reference (red). At early times it is clearly seen that both the conductance and the spike threshold are significantly increased. f Dynamics of the EIF model parameters during the refractory period. The parameters obtained from the fits of the I–V curves in e are plotted as a function of the time since the last spike (symbols) and fitted with exponential functions (green). g Comparison of the prediction of the refractory EIF (rEIF) model (green) with a voltage trace of the Wang-Buzsáki model (black) shows excellent agreement, with 96% of the spikes correctly predicted by the EIF model within a 5ms window

