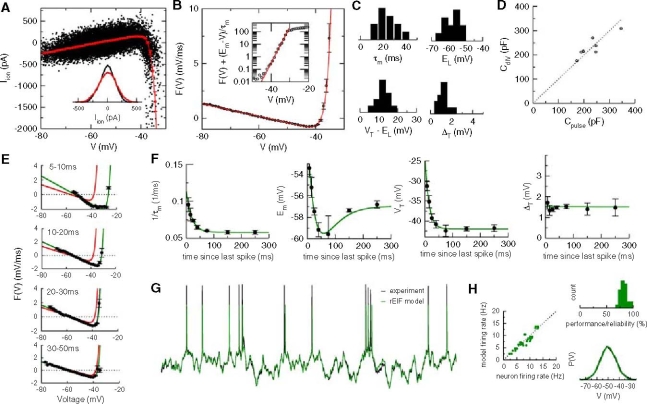
Fig. 2.
Application of the dynamic I–V method to layer-5 pyramidal cells. a The intrinsic membrane current is plotted against the membrane voltage (black symbols). The dynamic I–V curve (red) is clearly seen to comprise a linear component in the subthreshold region followed by a sharp activation in the region of spike initiation. Inset: Examination of the variance of I
ion near the resting potential in the absence (black) or presence (red) of injected current suggest that the majority of the variance comes from intrinsic noise. b The function  is plotted here (symbols) together with the EIF model fit (red). Inset: The exponential rise of the spike generating current is shown in a semi-log plot of F(V) with the leak currents subtracted. c Histograms of the EIF model parameters for a sample (N = 12) of pyramidal cells, showing considerable heterogeneity in the response properties of neurons in this population. d The cellular capacitance calculated with our optimization method (see text) is compared to the result of the standard current-pulse protocol, showing a good agreement between the two methods. e Spike-triggered dynamic I–V curves. The I–V curves measured in small time slices after a spike are plotted together with the EIF fit (green) and the pre-spike I–V curve as a reference (red). f Post-spike dynamics of the EIF model parameters (symbols) together with the fits to an exponential model. While conductance and spike threshold could be accurately fitted with a single exponential, the variation in the equilibrium potential E
L required two exponential components for a good fit. The spike width Δ
T did not vary significantly for these cells. g Comparison of the prediction of the rEIF model (green) with experimental data shows good agreement in the subthreshold region and in the prediction of spike times. h Summary of the performance of the rEIF model for the 12 cells investigated. Left: Prediction of the firing rate. Top right: Histogram of the performance measure. Bottom right: Voltage distribution for the rEIF model (green) and the experimental data (black). The figure is adapted from (Badel et al. 2008)

