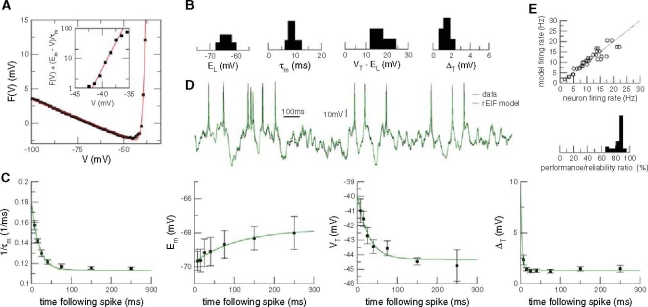
Fig. 3.
GABAergic cortical interneuronmodels derived using the dynamic I–V methodology. a The function  for a fast-spiking interneuron is plotted (symbols) together with the EIF model fit (red). Inset: The exponential rise of the spike generating current is shown in a semi-log plot of F(V) with the leak currents subtracted. b Distribution of the EIF model parameters for a sample (N = 6) of interneurons. The histograms overlap significantly with those of pyramidal cells shown in Fig 2. c Post-spike dynamics of the EIF model parameters (symbols) together with the fits to an exponential model. In the case of cortical interneurons all parameters could be fitted satisfactorily with a single exponential. Note that the transient, post-spike increase in the spike onset V
T (∼4mV) is smaller in this fast-spiking interneuron than that for pyramidals (∼15mV-see Fig. 2). d Comparison of the prediction of the rEIF model (green) with experimental data shows close agreement in the subthreshold region and in the prediction of spike times. e Summary of the performance of the rEIF model for the 6 cells investigated. Top: Prediction of the firing rate. Bottom: Histogram of the performance measure

