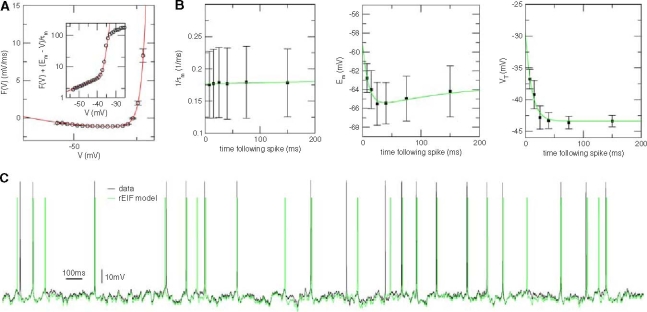
Fig. 4.
Application of the dynamic I–V method with conductance injection. a The function  is plotted (symbols) together with the fit (red) to the function (14). Inset: Two exponential components are clearly seen in a semi-log plot of F(V) with the leak currents subtracted. b Post-spike dynamics of the EIF model parameters (symbols) together with the fits to an exponential model. The time-dependent resting potential shows a clear biphasic response as was seen for layer-5 pyramidals in the current-injection protocol. c Comparison of the prediction of the rEIF model (green)with experimental data again shows good agreement in the subthreshold region and in the prediction of spike times

