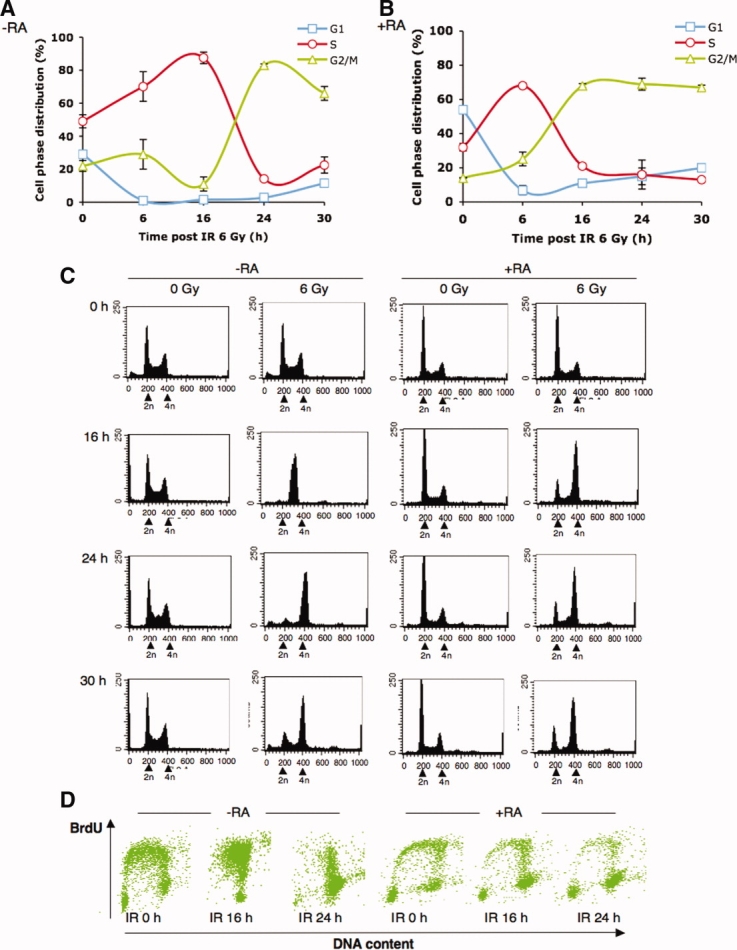
Figure 1.

Undifferentiated EC cells underwent prominent S-phase delay followed by G2 arrest in response to IR. Undifferentiated and differentiated NCCIT cells were irradiated (6 Gy) followed by flow cytometry analysis of DNA content. Percentages of (A) undifferentiated (−RA) and (B) differentiated (+RA) NCCIT cells in G1, S, and G2/M cell cycle phase as a function of time after irradiation (means ± SD; from three independent experiments) were determined using Modfit software. (C): Representative histogram of cell cycle distribution in irradiated undifferentiated (−RA) and differentiated (+RA) NCCIT cells at indicated time points. Peaks corresponding to cells with 2n and 4n DNA content were indicated by arrows. (D): Dot plot representation of PI/BrdU double parameter analysis of irradiated undifferentiated (−RA) and differentiated (+RA) NCCIT cells at indicated time points. x-axis indicates DNA content and y-axis indicates BrdU positive labeling. Abbreviations: BrdU, bromodeoxyuridine; IR, ionizing radiation; RA, retinoic acid.
