
Figure 3.
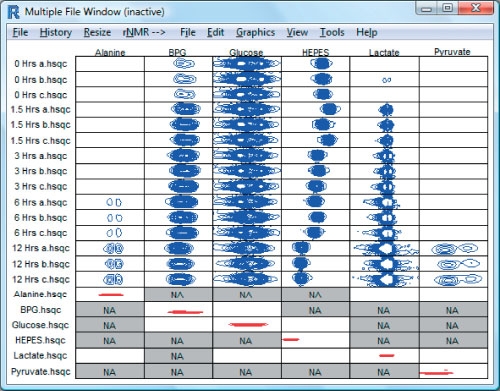
A screenshot from the rNMR multiple-file window showing ROIs containing two-dimensional NMR signals (blue) from 6 molecules observed in 15 spectra of red blood cell extracts incubatedwith [U-13C]-glucose. Spectra correspond to aliquotswithdrawn over a 12-h time course. The red peaks are from small molecule standards corresponding to each of the observed metabolites. 4-(2-hydroxyethyl)-1-piperazineethanesulfonic acid (HEPES), which was included in the incubation medium, serves as a monitor of pH; its chemical shift can be used to determine the pH of each aliquot. If an ROI falls outside the chemical shift range of a spectrum, rNMR displays a gray box with the designation ‘NA.’.