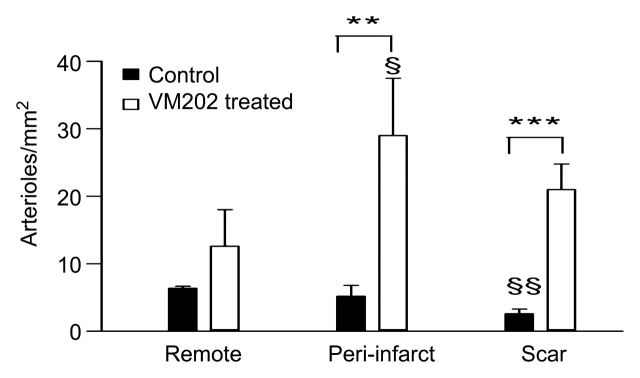
Figure 8b:
Histograms of quantitative analysis of histopathologic findings show regional capillary (top left) and arteriole (top right) densities in remote myocardium, periinfarcted myocardium, and scar tissue. Bottom: arteriole wall thickness and wall thickness–to-lumen diameter ratio in the infarcted region of control (black columns) and treated (white columns) animals. The abundant arterioles seen in treated animals have thinner walls and lower wall thickness–to-lumen diameter ratio than in control animals, suggesting that these arterioles are newly formed. * = P < .05, ** = P < .01, *** = P < .001 compared with control animals, § = P < .05 compared with scar tissue, §§ = P < .01 compared with remote myocardium, and §§§ = P < .001 compared with remote myocardium. Error bars = standard error of the mean.

