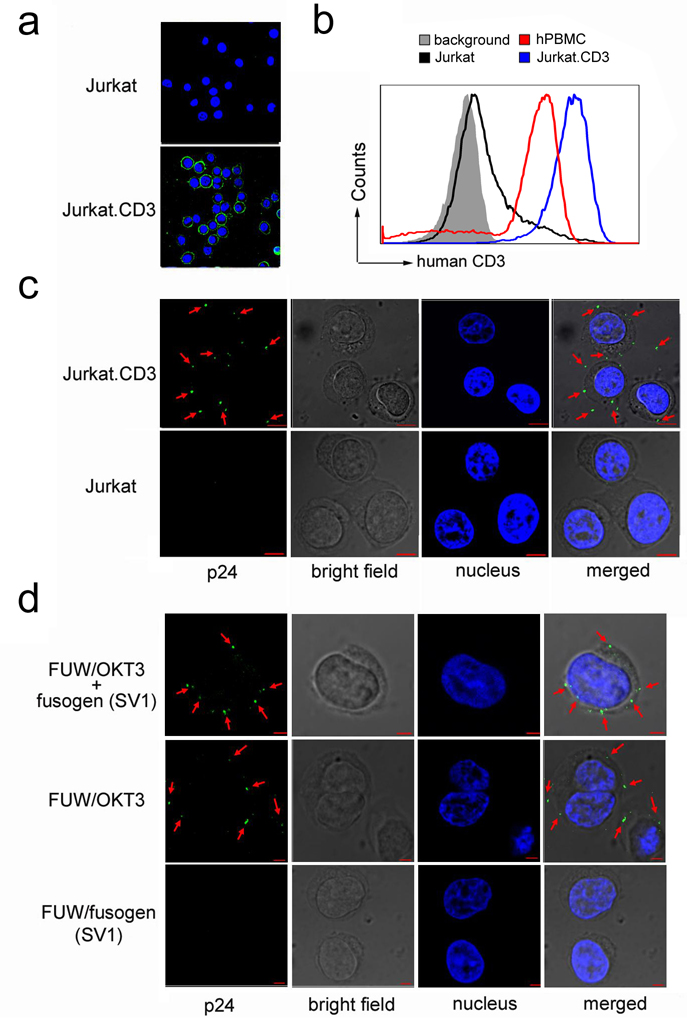
Fig. 4.
Confocal imaging analysis of cell-virus binding. (a) Imaging detection of the surface expression of CD3 antigen on Jurkat.CD3 and Jurkat cells. CD3 was probed by immunostaining the cells with a mouse anti-human CD3 antibody and a secondary Cy5-conjugated anti-mouse antibody. The green color represents the CD3 on the cell surface and the blue color represents the cellular nucleus. (b) FACS analysis of the surface expression of CD3 on Jurkat, Jurkat.CD3, and human peripheral blood mononuclear cells (PBMC). (c) Imaging analysis of the lentiviral vector FUW/OKT3+SV1 binding to Jurkat.CD3 or Jurkat cells. For cell-virus binding, cells (2 × 10⁶) were incubated with vector particles and were immunostained by antibody specific for the capsid protein p24 (green). The cellular nuclei were counterstained by 4'-6-diamidino-2-phenylindole (DAPI, blue). (d) Indicated lentiviral particles (FUW/OKT3+SV1, FUW/OKT3 or FUW/SV1), were incubated with Jurkat.CD3 cells and the same immunostaining as described in (c) was performed. The scale bar represents 5 µm.

