Figure 2.
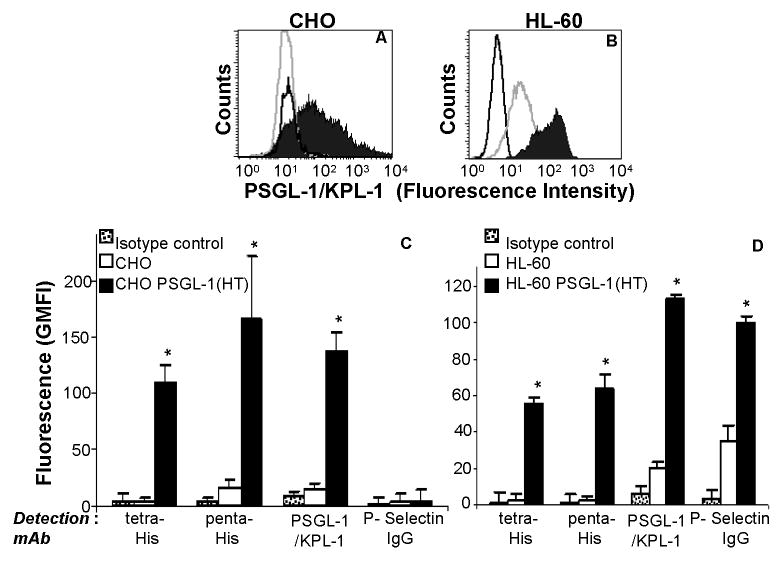
Detection of PSGL-1(HT) on CHO and HL-60 cell surface. Wild type CHO and HL-60 cells, and these same cell lines expressing PSGL-1(HT) were probed with monoclonal antibodies against PSGL-1 (clone KPL-1). Panels A corresponds to representative histogram for CHO and CHO PSGL-1(HT), while panel B are for HL-60 and HL-60 PSGL-1(HT). Black-filled peak corresponds to cells expressing PSGL-1(HT), grey-empty peaks correspond to wild type CHO/HL-60 that did not express PSGL-1(HT). Black-empty peaks correspond to isotype control antibody. Panel C and D presents geometric mean fluorescence intensity (GMFI) + SEM data for CHO and HL-60 cells respectively (N=3). As seen, PSGL-1 expression on HL-60 PSGL-1(HT) was 5.7 times higher and P-selectin binding was elevated 2.9-fold in comparison to wild-type HL-60. *p<0.05 with respect to wild-type CHO/HL-60 cells.

