Figure 6.

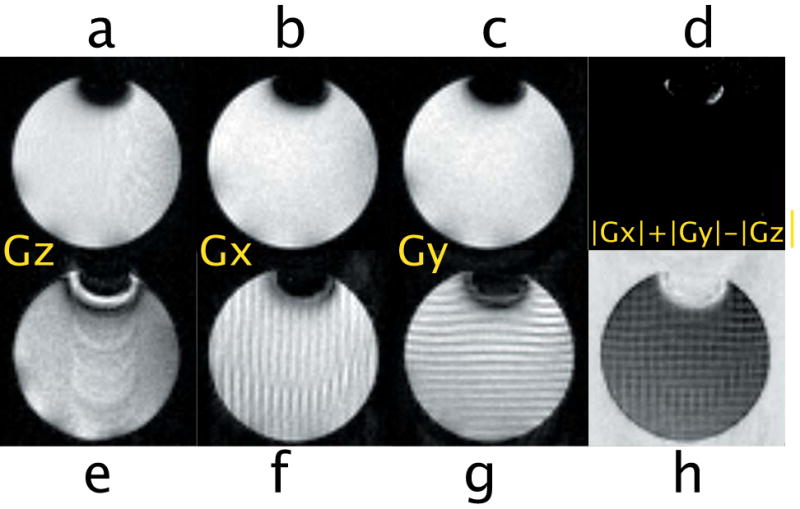
iDQC images acquired with a phase cycle to select the iDQC signal. Top row dc=90μm, bottom row dc=1mm. d and h are anisotropy map images obtained by a point by point subtraction of the magnitude images.

iDQC images acquired with a phase cycle to select the iDQC signal. Top row dc=90μm, bottom row dc=1mm. d and h are anisotropy map images obtained by a point by point subtraction of the magnitude images.