
Figure 4. PE and red fluorescent proteins at higher power levels.
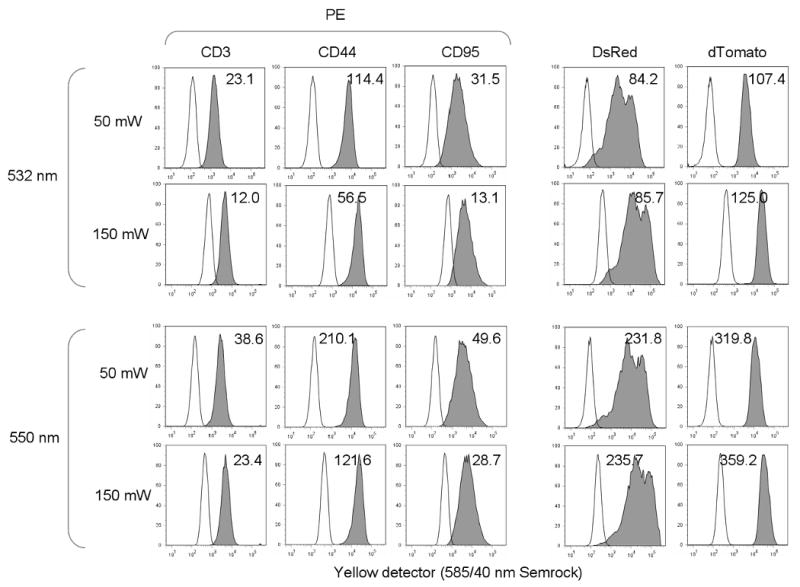
Three left columns, EL4 mouse thymoma cells were labeled with biotin-anti-CD3, CD44 or CD95 antibody followed by streptavidin conjugated to PE, and analyzed on the LSR II using 532 nm lasers at 50 and 150 mW, and the 550 nm laser at 50 and 150 mW. Two right columns, SP2/0 cells were stably transfected with DsRed and dTomato and similarly analyzed. All cells were analyzed through a 585/40 nm bandpass filter. Filled peaks indicate labeled cells, unfilled peaks indicated unlabeled controls. The sensitivity indices (described in the Materials and Methods) are indicated on each histogram. PMT voltages were fixed for all samples.