
Figure 6. Spectral overlap from green-yellow laser excitation.
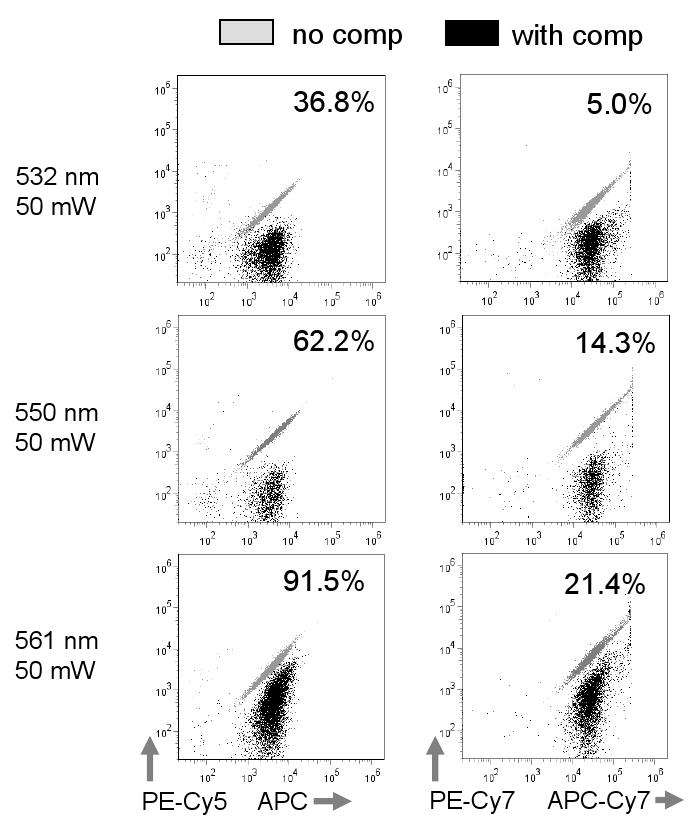
Analysis of APC and APC-Cy7 labeled cells using the filter/detector configuration shown in Figure 8. APC and APC-Cy7 signal overlap into the PE-Cy5 and PE-Cy7 detectors is shown in overlaid dotplots without and with computer-calculated compensation (grey and black dots, respectively). Values for PE-Cy5 -% APC or PE-Cy7 - %APC-Cy7 fluorescence are shown on each plot.