
Fig. 1.
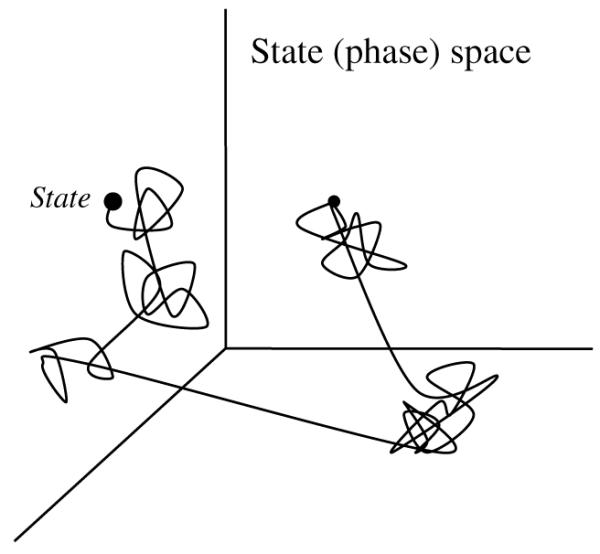
A schematic illustration of 3-D state space. In this example, a system is fully described by 3 state variables. At any given moment, the system is represented as a point (state) in this space. The trajectory of the system traces out the time evolution of changes of the system’s state.