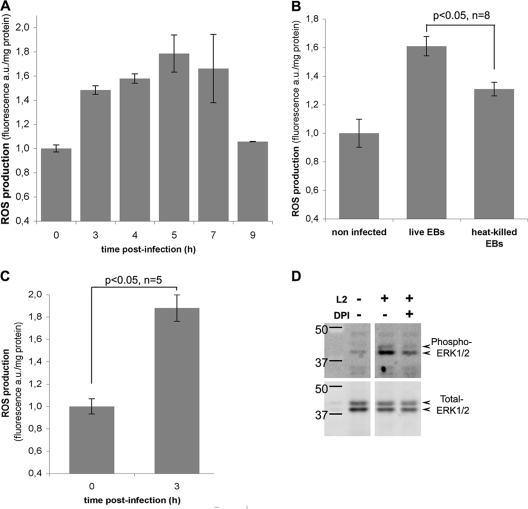
FIG. 1.
Transient production of ROS during Chlamydia infection. (A) ROS production was measured in HeLa cells infected with C. trachomatis serovar L2 for the indicated times. (B) ROS production measured 5 h p.i. with live or heat-killed C. trachomatis EBs. (C) ROS production measured 3 h p.i. with the species C. caviae. (A, B, and C) For each time point, incubation with CM-H2DCFDA was initiated 2 h before lysis. The cells were lysed at the indicated times, and fluorescence and protein were measured for each lysate. Fluorescence arbitrary units (a.u.) were divided by the protein content. The normalized fluorescence of control uninfected cells (zero hour time point) was set to 1. For each panel, one representative experiment of at least three is shown, and the error bars correspond to the standard deviation of the five replicates in this single experiment. Statistical analyses were conducted for the indicated number of independent experiments. (D) Phosphorylation of ERK1/2 upon C. trachomatis infection. Levels of ERK1/2 phosphorylation were measured by Western blotting using specific anti-phospho-ERK1/2 antibodies (top row) in lysates of control cells and of cells infected with C. trachomatis for 9 h. Where indicated, 10 μM DPI was added to the cells 2 h p.i. The blots were reprobed with anti-total ERK1/2 antibodies (bottom row) to verify that the total ERK contents were identical in all samples.

