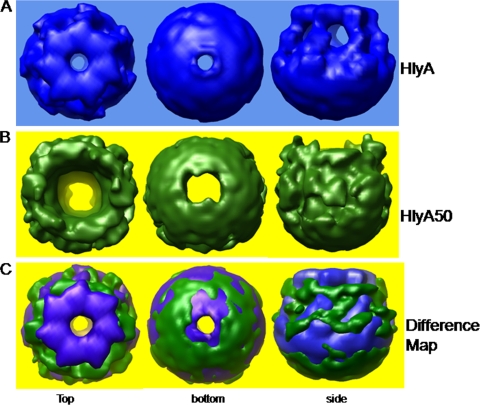
FIG. 8.
Difference map between HlyA and HlyA50 oligomers. (A) Three-dimensional structure of the HlyA oligomer. (B) Three-dimensional structure of the HlyA50 oligomer. (C) Difference map between HlyA and HlyA50 oligomers. The left column is the top view, the middle column is the bottom view, and the right column is the side view. In this case, blue shows the contribution of the HlyA oligomer and green shows the contribution of the HlyA50 oligomer.

