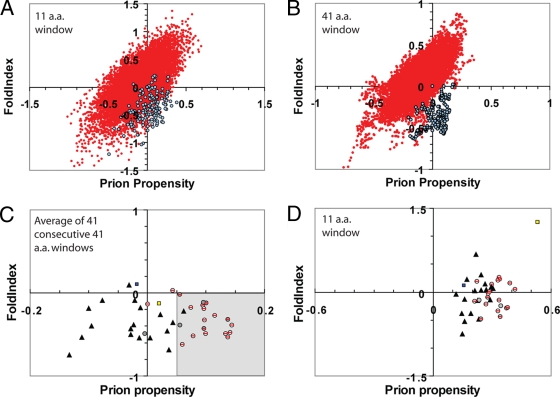
FIG. 6.
Predicting prion propensity for Q/N-rich domains. (A and B) Prion propensity and FoldIndex order predictions for 20 randomly selected open reading frames (red) (see Materials and Methods for gene names) and the PFDs of Sup35p and Ure2p (blue). Proteins/PFDs were scanned using an 11-amino-acid (A) or 41-amino-acid (B) window size. For each window, the predicted prion propensity (calculated as the average ln (ORobs) across the window) versus the predicted FoldIndex order propensity (where negative values are associated with disorder) was plotted. (C and D) Prion propensity and order prediction for Q/N-rich domains with prion-like activity (circles), for Q/N-rich domains shown by Alberti et al. (1) to lack prion-like activity in four prion assays (shaded triangles), for the HET-s PFD (blue square), and for human PrP (yellow square). Q/N-rich domains with prion-like activity include both known PFDs (shaded circles) and domains shown by Alberti et al. to have prion-like activity in four prion assays (circles with red slashes). For each potential PFD, the average prion propensity and average disorder are plotted for the 41 consecutive 41-amino-acid windows with maximum average predicted prion propensity (C) or the 11-amino-acid window with maximum prion propensity (D). The region of the graph identified as prion prone in panel C is shaded.

