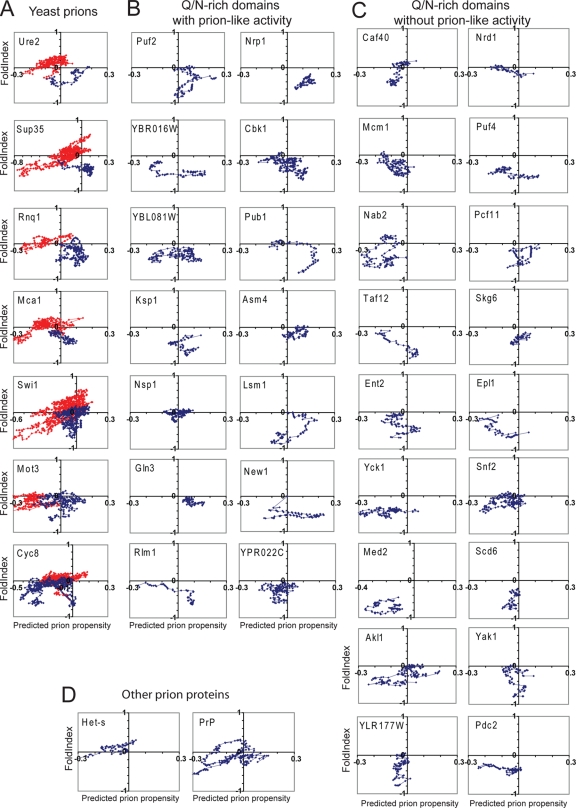
FIG. 7.
Prion propensity maps. (A) Scanning of known yeast prion proteins. Each of the yeast prion proteins was scanned using a 41-amino-acid window size, calculating for each window the average FoldIndex order propensity and prion propensity. Prion propensities were calculated based on the average ln (ORobs) for each amino acid in the window. The prion domains of each protein are shown in blue and the nonprion domains in red. (B) Scan of Q/N-rich domains tested by Alberti et al. that showed prion-like activity in all assays. (C) Scan of Q/N-rich domains tested by Alberti et al. that lacked prion-like activity in all assays. (D) Scan of the HET-s PFD and the human prion protein PrP.

